Three Things: Walking in the Rain
[NB: check the byline, thanks. /~Rayne]
“I always like walking in the rain, so no one can see me crying.”
― Charlie Chaplin
Now is not a good time to be walking in the rain, even if it hides your tears (I’m talking to you, Kevin McCarthy).
~ 3 ~
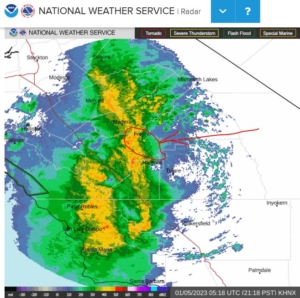
There are numerous warnings and advisories about the extreme weather event underway in California. The central portion of the state is and will be hardest hit over the next 12-24 hours because of a “bomb cyclone” but the entire state will feel the effects in varying degrees.
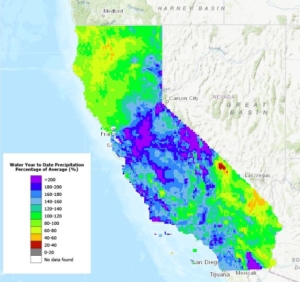
In no small part it will be due to the accumulation of rain before this cyclone; the ground in many area is already waterlogged and unable to soak up more water. As you can see from this California Water Watch map based on Tuesday’s data, portions of central CA had already passed 200% of the year-to-date precipitation before the cyclone hit.
There’s rain forecast every day for the next week as well; it’s hard to imagine there not being some enormously dangerous effects arising from this much rain in a state which ordinarily doesn’t see this much rain in an entire season.
~ 2 ~
But it’s not just the rain which is problematic.
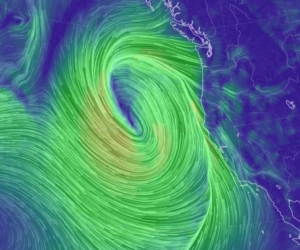
[Graphic: Surface wind, approx. 3:15 PM PST January 4, 2023 via earth.nullschool.net]
Power outages are ongoing, some beginning late morning Wednesday. The entire Mission district in the Bay area went dark in early evening local time; by 10:00 p.m. 100,000 residents had lost power in the region.
(Gee, I wonder how Silicon Valley and San Jose are handling this weather event.)
Portions of Santa Cruz upgraded from evacuation warning to evacuation ordered.
I listened to a podcast Wednesday evening on KQED featuring Daniel Swain, climate scientist, Institute of the Environment and Sustainability at UCLA; Brian Garcia, warning coordination meteorologist, National Weather Service SF Bay Area/Monterey; and Gerry Diaz, newsroom meteorologist, SF Chronicle. I was struck by how blasé and banal some of the inquiries to the station were, like how to deal with problematic trees, or whether a person living less than 14 feet above sea level on a canal might be at risk of flooding. It was already far too late to be asking these kinds of questions when much of the area was already without power, the coastline was surely being battered by gale and hurricane-force winds, and people should have evacuated 12 hours earlier.
So much denial.
~ 1 ~
The really sad part: just like the wildfires California has faced the last handful of years, this isn’t the last time there will be a weather event of this magnitude. There will be more, they will get bigger, they will happen more often. Denial won’t prevent them or make them go away, any more than denial has worked to fend off the COVID pandemic.
Yet denialists will point to other disasters elsewhere in the U.S. claiming California isn’t anything special, normalizing weather disasters.
This normalization, though, denies the increasing number of weather disasters, keeping pace with the mounting climate crisis:
Eight out of the 10 years with the highest number of natural disasters occurred in the last decade.
Since 1980, there have been 332 billion-dollar natural disasters in the US. In total, these disasters have cost $2.2 trillion after adjusting for inflation and took the lives of more than 15,000 people. This includes 160 severe storms, 57 tropical cyclones or hurricanes, 36 floods, 30 droughts, 20 wildfires, 20 winter storms, and nine freezes.[1]
In the 1980s, there were a total of 31 billion-dollar natural disaster events, resulting in 2,970 deaths. In the 2010s, this number rose to 128 such events, resulting in 5,227 deaths.
[Source: USAFacts.org, Is the number of major natural disasters increasing?, updated November 5, 2022]
Now denialists are currently obstructing the operation of U.S. government by holding out against the majority of their party’s caucus and refusing to elect their party’s choice for House Speaker. By denialist I mean the members of the House GOP caucus who denied the results of the 2020 election, who objected to certification of the election, who were Trump-y enough to be endorsed by the orange-skinned golf cheat. None of these people are serious about governance; none of them will do anything constructive as members of Congress with regard to climate change.
They are simply continuing the January 6 insurrection by other means.
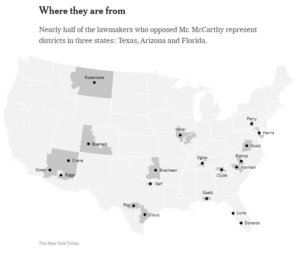
It must be particularly galling to House Speaker candidate Kevin McCarthy (R, CA-20), being held hostage by a couple handfuls of people from wide-flung places across the U.S.:
[Source: https://www.nytimes.com/interactive/2023/01/04/us/politics/house-speaker-republicans-vote-against-mccarthy.html]
…while McCarthy’s district is currently floating away, and he’s unable to do anything about federal response as a member of Congress.
~ 0 ~
If you’re in California, please, please, PLEASE heed the National Weather Service’s warnings about conditions in your area.
Mastodon user Jenny from the Bloc (@[email protected]) pulled together a nice list of informational links for use by Californians and curious folks outside the Golden State:
https://aware.zonehaven.com/search – map of evacuation orders and statuses (not complete – only works where integrated with local services)
https://pgewam.lovelytics.info/pge_weather_app/ – pg&e-run weather map with information on winds, precipitation, and more
https://pgealerts.alerts.pge.com/outages/map/ – pg&e-run map of outages. lets you search by address
https://poweroutage.us/area/state/california – third party map of outages. does *not* let you search by address
https://calalerts.org/ – landing page for county-based emergency alerts. note that each county runs their own system, so if you want to keep track of multiple locations in different counties you will need a unique account for each county
https://sfplanninggis.org/floodmap/ – hypothetical flood risk map for city of sf (NOT real time)
https://tidesandcurrents.noaa.gov/map/# – noaa-run map of tides, water levels, meteorological observations, and more
https://marin.onerain.com/map/?view=www_marincounty – marin-based map of winds, precipitation, river levels, and more
https://www.oaklandca.gov/topics/winter-storms city of oakland’s dedicated winter storms webpage with further links to oakland-specific resources
https://www.windy.com/ – weather map with information on temperature, precipitation, air quality, and more
https://quickmap.dot.ca.gov/ caltrans-run map of road conditions
https://sonomacounty.maps.arcgis.com/apps/webappviewer/index.html?id=69a0e54e9e2b48c086d122027b21c961 – sonoma county evacuation map
https://slvpost.com/at-home-when-debris-flow-strikes-there-is-hope/ – article about recognizing and responding to debris flows (land slides, mud slides, etc)https://www.wunderground.com/ – weather site that is extra useful for under-served areas
https://alert.valleywater.org/map?p=map – surface water data & map for the south bay
https://www.cityofpaloalto.org/Departments/Public-Works/Engineering-Services/Creek-Monitor-Cam creek monitor and camera for palo alto
https://www.nytimes.com/interactive/2022/08/12/climate/california-rain-storm.html – not about this storm in specific, but an interactive article predicting exactly this kind of storm, explaining how we got here, and exploring what we can do to respond to storms of this type.
For the rest of our community members, do spend some time this week checking your emergency/disaster preparedness plan.

