You may have seen discussions about this project around the Toobz. In it, scholars use supercomputers to analyze the tone of news coverage. Their results from Egypt and Tunisia–showing low sentiment right before this year’s revolutions–suggest you can predict volatile events with such analysis.
I decided to look further at the study, not least, because of Dianne Feinstein’s complaint earlier this year that the CIA had totally missed stirrings of rebellion in both countries.
Feinstein set a skeptical tone at the opening of the hearing, saying Obama and other policymakers deserved timely intelligence on major world events. Referring to Egypt, she said, “I have doubts whether the intelligence community lived up to its obligations in this area.”
After the hearing, Feinstein said she was particularly concerned that the CIA and other agencies had ignored open-source intelligence on the protests, a reference to posts on Facebook and other publicly accessible Web sites used by organizers of the protests against the Mubarak government.
Speaking more broadly about intelligence on turmoil in the Middle East, Feinstein said, “I’ve looked at some intelligence in this area.” She described it as “lacking . . . on collection.”
According to DiFi, the CIA missed the Arab Spring because they weren’t monitoring open source materials (an argument that WikiLeaks cables seem to confirm). And this study is all the more damning for our intelligence community, because this study uses their own (actually, Britiain’s) open source collection.
Recognizing the need for on–the–ground insights into the reaction of local media around the world in the leadup to World War II, the U.S. and British intelligence communities formed the Foreign Broadcast Information Service (FBIS — now the Open Source Center) and Summary of World Broadcasts (SWB) global news monitoring services, respectively. Tasked with monitoring how media coverage “varied between countries, as well as from one show to another within the same country … the way in which specific incidents were reported … [and] attitudes toward various countries,” (Princeton University Library, 1998) the services transcribe and translate a sample of all news globally each day. The services work together to capture the “full text and summaries of newspaper articles, conference proceedings, television and radio broadcasts, periodicals, and non–classified technical reports” in their native languages in over 130 countries (World News Connection, 2009) and were responsible for more than 80 percent of actionable intelligence about the Soviet Union during the Cold War (Studeman, 1993). In fact, news monitoring, or “open source intelligence,” now forms such a critical component of the intelligence apparatus that a 2001 Washington Post article noted “so much of what the CIA learns is collected from newspaper clippings that the director of the agency ought to be called the Pastemaster General.” (Pruden, 2001)
While products of the intelligence community, FBIS and SWB are largely strategic resources, maintaining even monitoring coverage across the world, rather than responding to hotspots of interest to the U.S. or U.K. (Leetaru, 2010). A unique iterative translation process emphasizes preserving the minute nuances of vernacular content, capturing the subtleties of domestic reaction. More than 32,000 sources are listed as monitored, but the actual number is likely far lower, as the editors draw a distinction between different editions of the same source. Today, both services are available to the general public, but FBIS is only available in digital form back to 1993, while SWB extends back more than three decades to 1979, and so is the focus of this study. During the January 1979 to July 2010 sample used in this study, SWB contained 3.9 million articles. The only country not covered by SWB is the United States, due to legal restrictions of its partner, the CIA, on monitoring domestic press.
If you believe that study author Kalev Leetaru’s research is valid (I think it’s very preliminary), then you basically grant that using his data analysis methods would have warned our intelligence services that the unrest in North Africa was exceptionally high.
But that’s not what I found most intriguing about Leetaru’s research.
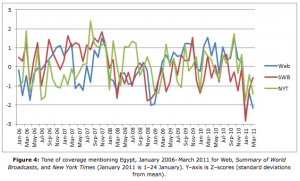 To measure whether the data from the SWB was an outlier, Leetaru compared how trends he saw from that data compared to the NYT and English language news more generally.
And as he explains, they generally track during this period, though with key deviations.
To verify that these results are not merely artifacts of the SWB data collection process, Figure 4 shows the average tone by month of Summary of World Broadcasts Egyptian coverage plotted against the coverage of the New York Times (16,106 Egyptian articles) and the English–language Web–only news (1,598,056 Egyptian articles) comparison datasets. SWB has a Pearson correlation of r=0.48 (n=63) with the Web news and r=0.29 (n=63) with the New York Times, suggesting a statistically significant relationship between the three. All three show the same general pattern of tone towards Egypt, but SWB tone leads Web tone by one month in several regions of the graph, which in turn leads Times tone. All three show a sharp shift towards negativity 1–24 January 2011, but the Times, in keeping with its reputation as the Grey Lady of journalism, shows a more muted response.
That is, for these events, local coverage was both more attuned to a change in sentiment and more reflective of the volatility of it. Or to put it another way, the NYT was slow to consider Egypt a major story, and never thought it was as big of a deal as the rest of the world did.
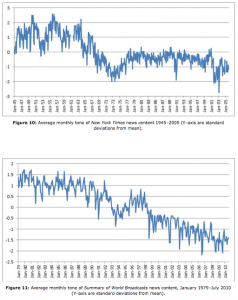 A far more interesting comparison of how the NYT outlook compared with the rest of the world comes in these two graphs, which show the NYT sentiment from 1945 to 2005 and the SWB sentiment from 1979 to 2010 (caution–neither the X nor Y axes here use the same scale; click to enlarge or go to the study for larger images).
You can sort of pick out events that might be driving sentiment on both scales. And they don’t entirely line up. Just as an example, the US seems to have reacted far more strongly–2 deviations as compared to .5 deviation–to what appears to be the first Gulf War in January 1991.
But note where both data sets converge more closely: with our second war against Iraq, with even the chief cheerleader for war, the NYT, measuring in the high 2 deviations from the mean in early 2003, and the international SWB measuring almost 2 deviations from the mean.
Significantly, the study shows that Egyptian sentiment before they revolted was in the 3+ range–more incensed than we were with the Iraq invasion, but not by much; whereas sentiment in Tunisia and Libya was less negative. Were we that close to revolting?
Now, I could be misreading both the stats and the explanation for the global bad mood as we lurched toward war against Iraq (though it also shows up in the Egyptian and Tunisian graphs; the sentiment is least severe in Libya). But if I’m not, it raises questions about what was driving the sentiment. In Europe especially and even in the US, there were huge protests against the war, though we never seemed all that close to overthrowing the war-mongers in power. I wonder, too, whether the sentiment also reflects the ginned up hatred toward Saddam Hussein. That is, it may be measuring negative sentiment, but partly negative sentiment directed against an artificial enemy.
So are these graphs showing that we were even closer to revolt than those of us opposed to the war believed? Or is the NYT graph showing that warmongers reflect the same nasty mood as people attempting to prevent an illegal war?
In any case, the NYT coverage reflected the crankiest mood in the US of the entire previous half century, significantly worse than the VIetnam period. I knew I was cranky; I wasn’t entirely sure everyone else was, too.


