Posts

The Fed Prepares To Screw Working People Again

The Federal Reserve Board has signaled its intention to hike interest rates, citing a fear of an overheated economy. Robert Reich has an opinion piece in The Guardian saying that raising interest rates will hurt working Americans. Reich explains; “They fear that a labor shortage is pushing up wages, which in turn are pushing up prices – and that this wage-price spiral could get out of control.” Reich explains why this is wrong.

The theory behind the Fed’s action is called the Philips Curve, which says roughly that as unemployment rises, inflation goes down, and vice versa, that as unemployment goes down, inflation increases. Here is a technical discussion of the history of the Philips Curve. This one is shorter and may be easier to read. They both say the same thing: there isn’t any obvious relation. The first piece describes some professional criticism of the Philips Curve which sadly has never had any impact on decision-making. The position of the economics profession apparently is that it must be right because they learned in in an advance economics course in College.

When you think about it, it’s utterly absurd: there are many sources of inflation, not the least of which is corporate pricing power. When most industries are highly concentrated in a few market participants they can set prices to maximize their profits. For example, Amazon dominates retailing. They just raised the price of their Prime service by $20 per household. There are about 150 million US subscribers. That’s about a $3 billion increase in revenues. Amazon blames wage increases and inflation for the increase. No, really. It comes on top of stupefying profits of $33.4 bn. So right there you get a huge increase in profits, vastly more than any wage increases or other inflationary costs.

Reich says that the impact of Fed interest rate hikes will fall on working Americans. As he puts it, “Higher interest rates will harm millions of workers who will be involuntarily drafted into the inflation fight by losing jobs or long-overdue pay raises.”

Let’s look at the numbers.
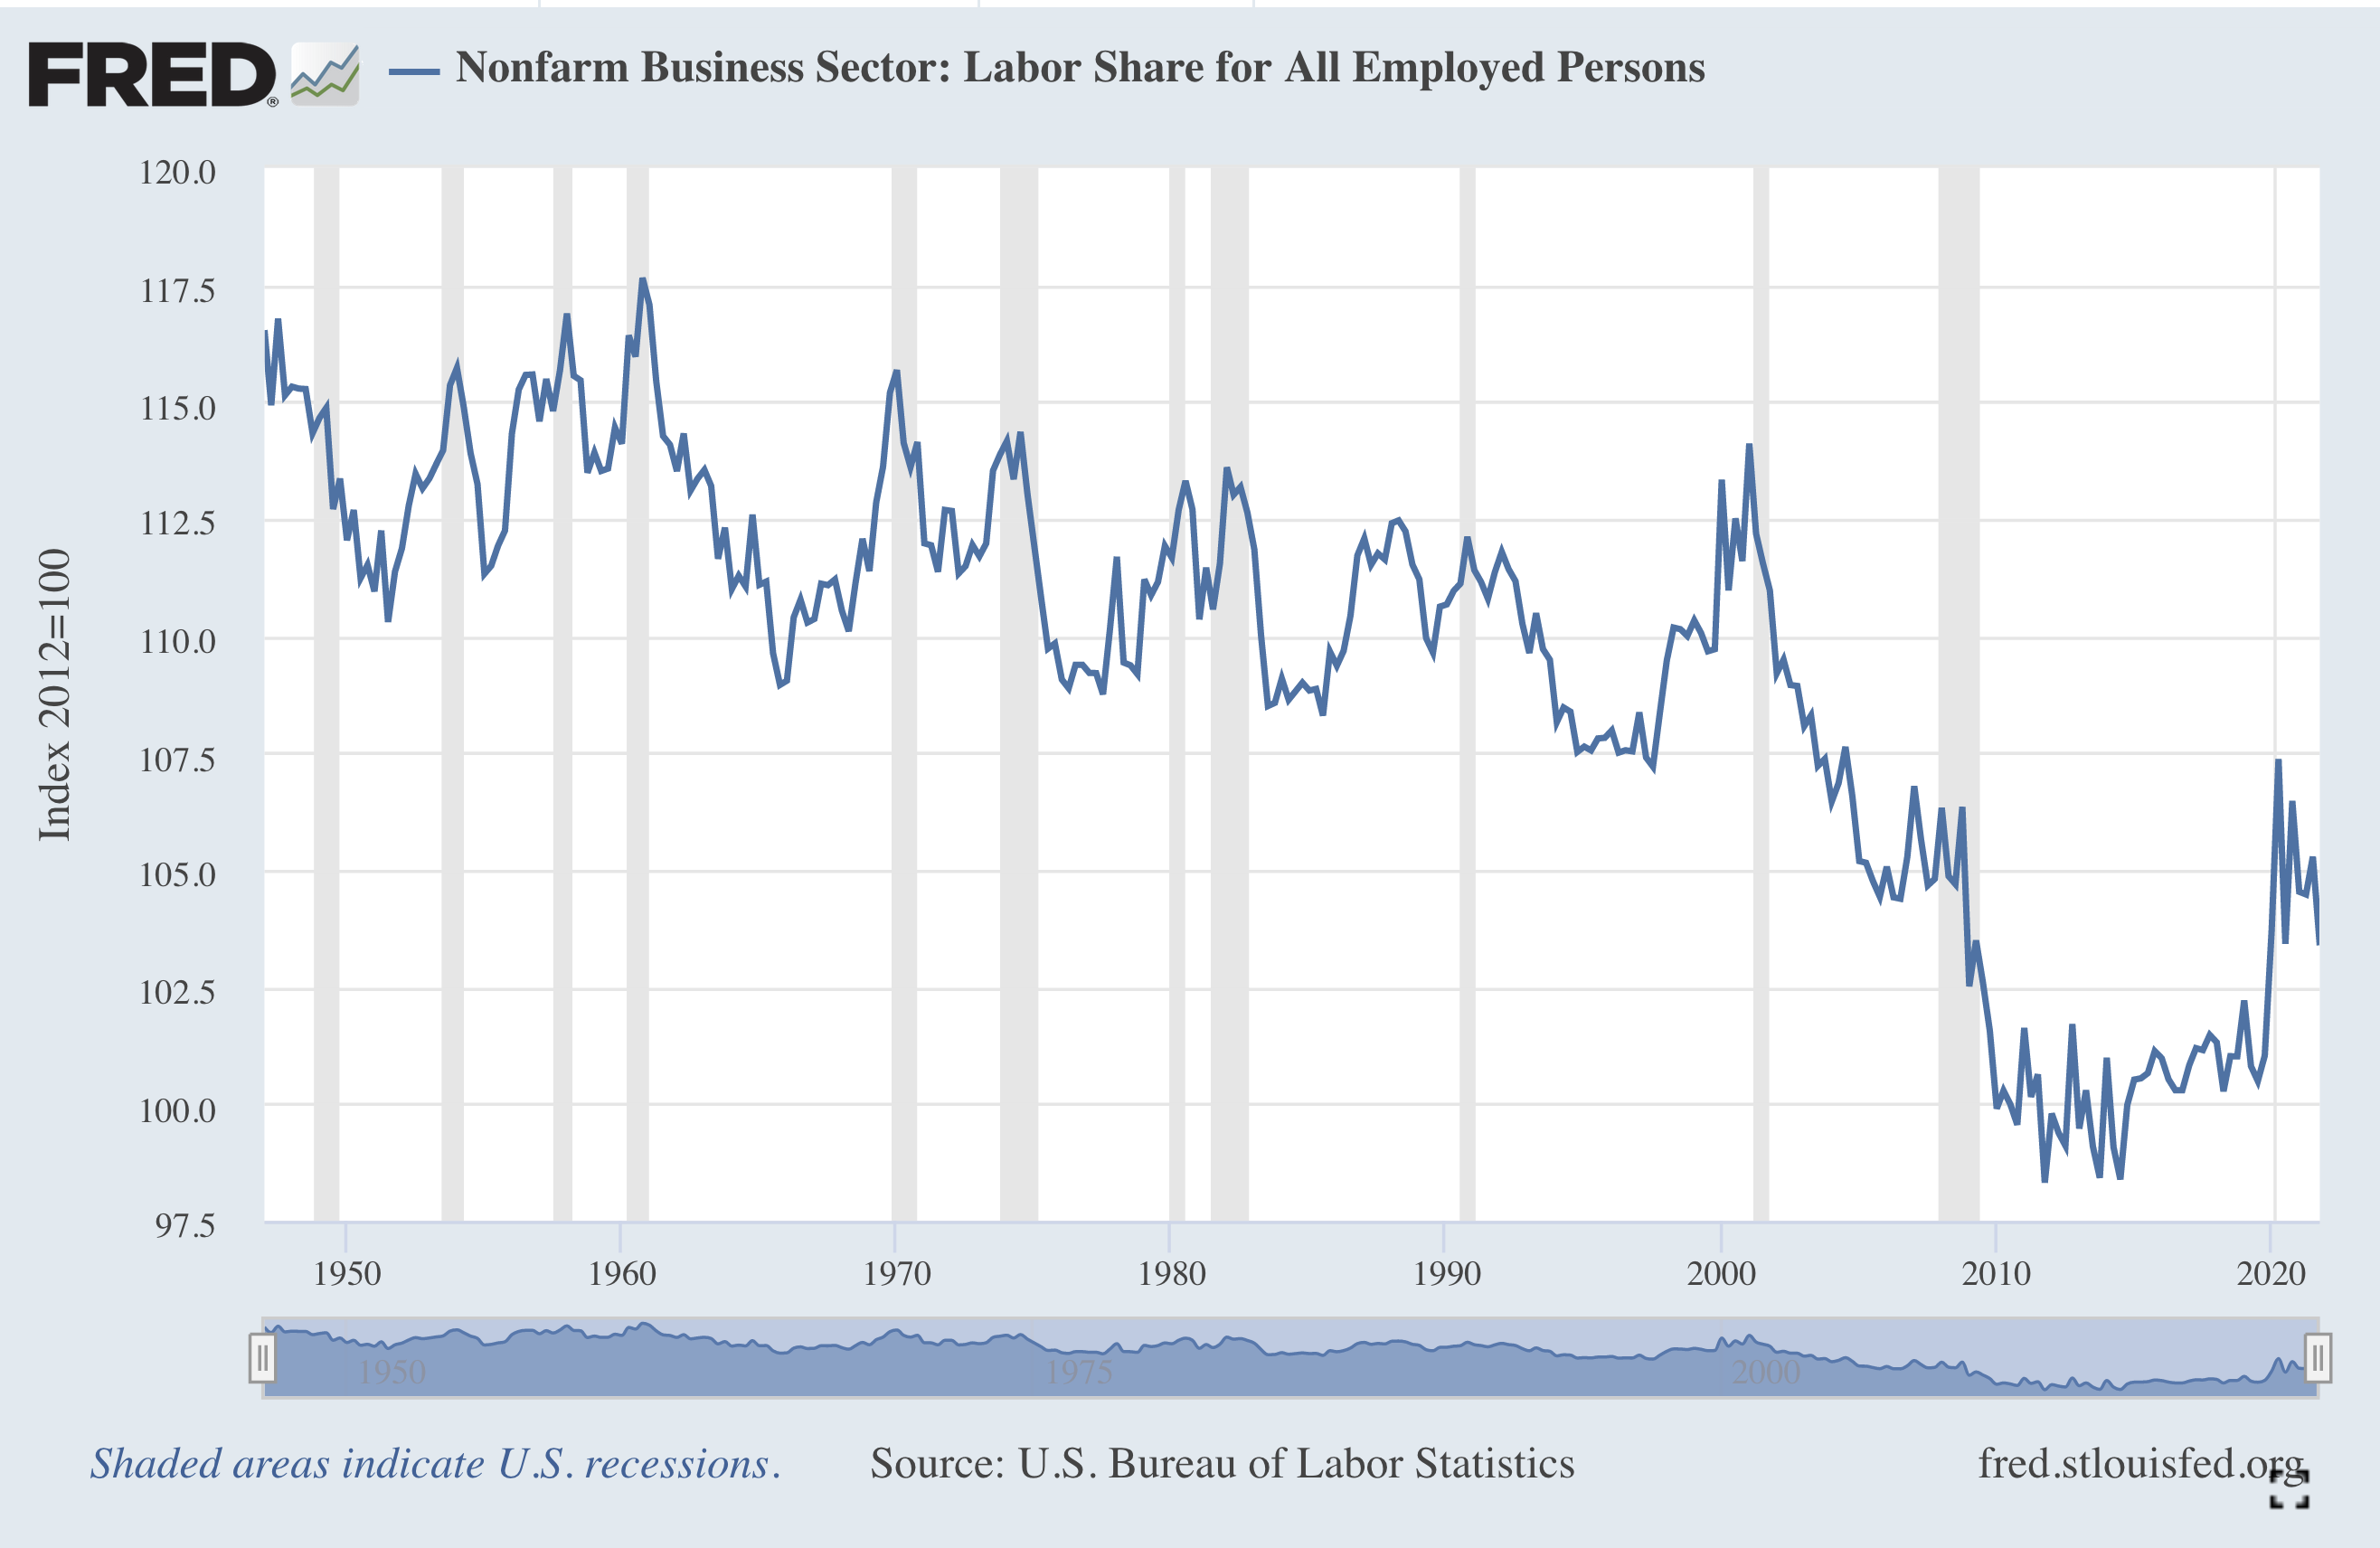

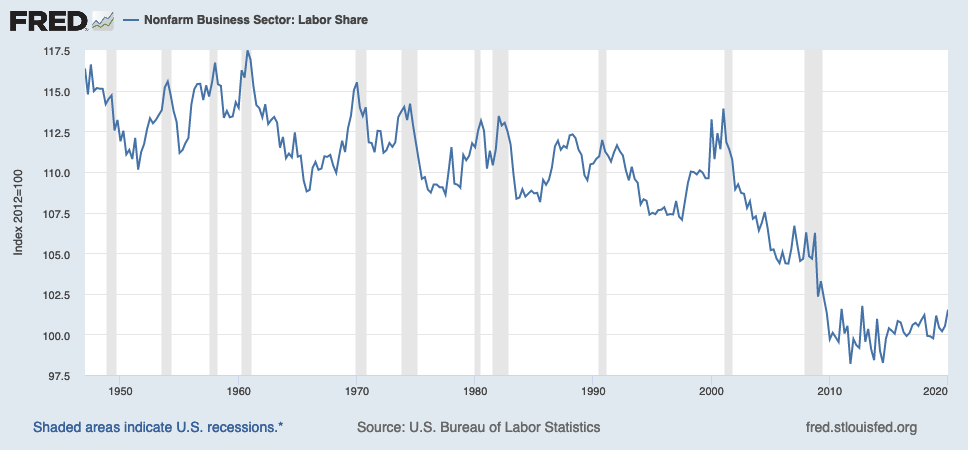
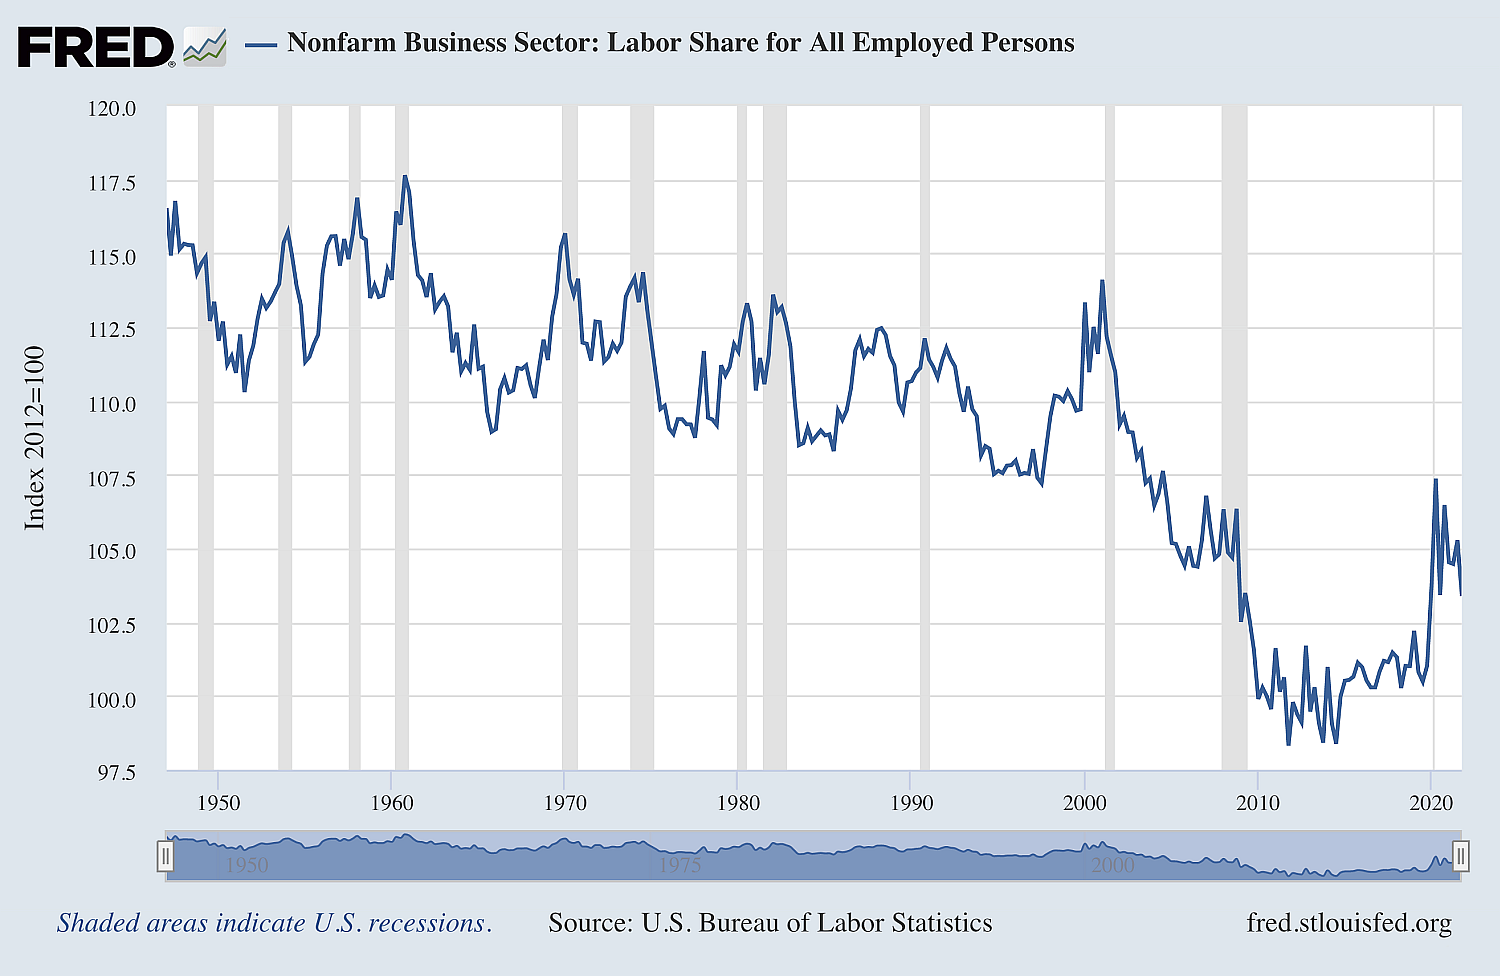
This chart shows the share of GDP going to labor*.

The gray bars are recessions. Almost all of the recessions since 1947 were triggered by interest rate increases. This chart says that when wages start to rise, the Fed raises rates, leading to recessions. Wage share falls. When it starts to rise again, the Fed triggers more rate increases. Before 1960, the labor share rose nearly to its previous highest levels. After 1960 the labor share peaks never reach their previous level.

The Great Crash led to a recession, one not caused by the Fed. In response, the Fed dropped interest rates to zero. But the labor share didn’t return to 2008 levels until 2020, and has fallen back since. Why does the Fed fear wages at this absurdly low share of GDP?

Now let’s look at corporate profits. This chart shows an estimate of corporate profits**.

The chart says that from 2012 to 2020, corporate profits were roughly steady at about $2.2 trillion. Then profits jumped straight up to the current level of $3.1 trillion in just two years. I’d guess the total rise is something like $1.4 trillion. That’s an astonishing increase. When did any media outlet point out that this is a major driver of inflation? Business reporters repeat the claims of corporate PR hacks that it’s all the fault of greedy American workers, or Covid, or supply chains***, and it’s just market forces at work. Talking heads will tell us that gigantic oligopolistic corporations will use those profits to build new factories and increase supplies. Or some other claptrap from Econ 101 textbooks.

Discussion

1. The Fed protects capital at the expense of labor. That’s what we mean when we say that inflation is such a big problem we have to hammer working people with unemployment to guard against inflation. It’s true that inflation affects working people, but why is there no way to solve that problem by penalizing capital? After all, inflation due to corporate actions, as in the case of the supply chain, market power, price-gouging and favorable government treatment is just as dangerous as any inflation driven by wages.

2. Reich points out that there isn’t any evidence of wage push inflation. Quite the contrary. Working people have been pounded by Covid and by aggressive union busting, and by price-gouging, and by surging health care costs and student debt. They haven’t caught up. He doesn’t say it, but the top quartile has done quite well, and the higher up in wealth and income people are, the better they’ve done.

3. Corporations have rigged the market structure so that working people are screwed. Government has done little to help. Can you imagine Congress stepping in to help working people? They can’t even raise the minimum wage. How long will people put up with this mistreatment?

=========
* Here’s the methodology. The number is a ratio, with all wages and salaries and proprietor’s labor compensation in the numerator, and what I take to be Gross Domestic Product as the denominator, all measured in constant dollars.

** Here’s the definition.

Profits from current production, referred to as corporate profits with inventory valuation adjustment (IVA) and capital consumption (CCAdj) adjustment in the National Income and Product Accounts (NIPAs), is a measure of the net income of corporations before deducting income taxes that is consistent with the value of goods and services measured in GDP. The IVA and CCAdj are adjustments that convert inventory withdrawals and depreciation of fixed assets reported on a tax-return, historical-cost basis to the current-cost economic measures used in the national income and product accounts. Profits for domestic industries reflect profits for all corporations located within the geographic borders of the United States. The rest-of-the-world (ROW) component of profits is measured as the difference between profits received from ROW and profits paid to ROW.

*** David Dayen, editor of The American Prospect, has produced a terrific series explaining the breakdown of the supply chain. Hint: it isn’t Biden’s fault.

The National Debt Is Sooooooo Big

Posts in this series

The Deficit Myth By Stephanie Kelton: Introduction And Index
Debunking The Deficit Myth
MMT On Inflation
Reflections On The Deficit Myth

Chapter 3 of Stephanie Kelton’s The Deficit Myth addresses the National Debt. It’s a very big number, and politicians use it to terrorize voters. Kelton tells a story about Senator Mike Enzi, R-WY, complaining about a CBO budget outlook report, saying it should put in the zeros instead of using the word “trillion”. And that’s how seriously we should take the problem. Remember what we learned in the last post: money is a debt on the books of the US government, but it’s also an asset in the hands of a currency user. That means that the National Debt tells us how much we collectively have received in assets from the Treasury.

Kelton says that fear of the National Debt is shared by everyone in and near government across the ideological spectrum, politicians, staffers, wonks and think-tankers. When she was Chief Economist for Bernie Sanders on the Senate Finance Committee, Kelton questioned the myth.

One of the most eye-opening things I learned came from a game I would play with members of the committee (or their staffers). I did this dozens of times, and I always got the same incredible reaction. I’d start by asking them to imagine that they had discovered a magic wand with the power to eliminate the entire national debt with one flick of the wrist. Then I’d ask, “Would you wave the wand?” Without hesitation, they all wanted the debt gone. After establishing an unflinching desire to wipe the slate clean, I’d ask a seemingly different question: “Suppose that wand had the power to rid the world of Treasuries. Would you wave it?” The question drew puzzled looks, furrowed brows, and pensive expressions. Eventually, everyone would decide against waving the wand. P. 77. [1]

Wiping out the National Debt means eliminating Treasuries, and that exposed the contradiction at the heart of the myth of the Very Scary Debt. We can’t get rid of Treasuries! But the raw number scares voters so many people continued to rant about the National Debt. They never asked why voters were scared, or questioned their role in creating that fear.

Intuitively, if deficits aren’t a problem unless they cause inflation, then the national debt isn’t a problem unless it causes inflation. In the same way interest on the national debt isn’t a problem unless it causes inflation. Kelton acknowledges that there may be limits on the size of the national debt, usually discussed in terms of the ratio between the national debt and the GNP. The US is nowhere near the size of the debt to GNP ratio of Japan, for example, so there’s no immediate problem. Assuming there is some limit, Kelton turns to the various ways we could eliminate the national debt.

One way would be to run government budget surpluses, as we did when Bill Clinton was President. We could easily do that by raising taxes on the rich and their corporations, slowly depleting their total wealth. That’s a good idea on its own terms, because it would reduce their political and economic power. Kelton says that in the past when the government has run surpluses for several years the result was depressions. I would add that if we did raise taxes we’d be destroyed in the shrieks of the rich saying that their money was being used to pay for social programs like Social Security.

Or, the Fed could get rid of all of the Treasuries with just a few clicks on a keyboard, by reducing the number in the Treasury Securities account and increasing the numbers in the bank account of the holders of the Treasury securites. Economists call this monetizing the debt.

Or, we could do it by continuing to spend as we see fit subject to the inflation constraint, but stop issuing new Treasuries. As the old ones mature, the Fed pays them by crediting the accounts of the holders with green dollars. We could stop that at any time we reached a level of debt that wouldn’t frighten even the most fearful Americans. or at some higher level. [2]

Once getting rid of Treasuries would have caused a problem, because the Fed used the market in Treasuries to control interest rates. That is no longer the only control mechanism available to the Fed. [3] But then what? Kelton discusses an article by Eric Lonergan, an economist and fund manager. Lonergan asks what would happen if Japan monetized all its bonds. I quote his analysis in full:

First, let’s go through the balance sheet effects: 1. The government now has no debt. 2. The value of the Japanese private sector’s assets is unchanged – they used to hold JGBs [Japanese Government Bonds], now they hold the same value in cash. So overnight, the government’s debt is eliminated, and the private sector’s net wealth is unchanged.

The income effects are also interesting: 1. The government’s budget position improves. 2. The income of the private sector falls because bonds paying interest have been replaced with cash holding none.

So what happens to the economy?

Most people tend to say, “hyperinflation”, but that makes little sense. Why on earth would the Japanese household sector rush out and buy things when their interest income has fallen, their wealth is unchanged, and they are used to falling prices. The private sector already has a high wealth to GDP ratio and are spending less than they produce (which is precisely why the government runs a deficit).

The Yen might weaken because the yield on overseas assets has risen relative to Japanese assets, but this spread is hardly offering much compensation for exchange rate risk. My conclusion is that nothing would change in Japan if you had 100% monetization of the stock of JGBs!

The takeaway is that getting rid of Japanese government debt wouldn’t affect the economy at least in the short term. Two possible problems: a) less spending because bond income disappears from the economy; and b) weakening of currency in international markets because there are higher return available on the bonds of other countries. In the case of the US, we can add that cash previously held as Treasuries suddenly isn’t producing any return, so its owners look elsewhere for returns. That might mean an increased purchases of assets by foreigners; purchase of the debt of other countries; or something else. But that’s not all bad, and I don’t know enough to work it out.

Kelton accepts Lonergan’s logic. Paying off US Treasury Securities is possible and likely would have minimal short-term effects. Late in the Clinton Administration the US ran budget surpluses, to the point that White House economists prepared a draft report titled Life After Debt. Here’s a discussion by David Kestenbaum of Planet Money. This report got labeled PRELIMINARY AND CLOSE HOLD OFFICIAL USE ONLY”, and Planet Money got it through FOIA. Then the Republicans cut taxes for the rich, with the usual pennies for the rest of us, so the problem evaporated.

In sum, the national debt isn’t a problem as long as it doesn’t lead to inflation. A lesser constraint might be the impact on the value of the dollar, which might affect international trade in unpredictable ways.

======
[Graphic via Grand Rapids Community Media Center under Creative Commons license-Attribution, No Derivatives]

[1] This is a good example of Kelton’s style. As you can see, it’s clear, simple, and direct English prose, the highest praise my high school English teacher, Brother Daniel, ever bestowed.

[2] Here’s a recent tweet from Scott Fullwiler, an MMT economist:

The core point is it should be done by the [Central Bank]—there’s no reason why the appropriate (for mkt conditions) change in risk-free, liquid securities should equal size of govt debt/surplus, & no reason for appropriate maturity structure to be same as what cost-minimizing [Treasury] chooses.

[3] For example, the Fed began to pay interest on the reserves commercial banks are required to keep at the Fed. There is a full explanation starting at P. 117.

[4] There are, of course, distributional issues for both Treasury Securities and for the interest they pay. This is a normative issue best dealt with by politicians, and not economists. One consideration is that many people benefit indirectly from interest on Treasuries through money market funds, investments by pension plans and direct purchase, because Treasuries are absolutely safe.

MMT On Inflation

Posts in this series
The Deficit Myth By Stephanie Kelton: Introduction And Index
Debunking The Deficit Myth

The second chapter of Stephanie Kelton’s The Deficit Myth deals with inflation. In Chapter 1, Kelton explains that the deficit is not a constraint on government spending. Instead, inflation is the important constraint. A deficit does not prove that the federal government is overspending. Only an increase in inflation proves Congress is overspending. Kelton says Congress shouldn’t tax and spend so as to deliver a balanced budget. Congress should spend and tax so as to deliver a balanced economy, one that serves all of us. She says that historically we have not done this, that we have chosen to focus of deficits and in so doing our economy has not served us well.

Definition and Description of Inflation

Inflation means a continuous rise in the price level. A bit of inflation is considered harmless and even something economists like to see in a healthy, growing economy. But if prices start rising faster than most people’s incomes, it means a widespread loss of purchasing power. Left unchecked, this would mean a decline in society’s real standard of living. In extreme cases, prices can even spiral out of control, gripping a country in hyperinflation. P. 44.

The danger of eroding incomes explains why everybody worries about inflation, and explains why politicians can use the threat of inflation to terrorize voters. It works, even though the problem for more than a decade hasn’t been too much inflation, it’s been too little. Ever since the Great Crash inflation has been less than 2% annually despite efforts of the Fed.

Kelton says that economists think of inflation as either cost-push or demand-pull. Demand-pull inflation occurs when consumer spending rises faster than the economy can produce goods and services. That hasn’t been a problem for a long time. Cost-push inflation can arise from disasters, which reduce the supply of something; from pricing power, as in the case of Big Pharma with its patents and trade secrets; or from workers gaining market power and demanding higher wages which businesses pass on to consumers. That last one is the only fear mainstream economists suffer, as far as I can tell.

The dominant theory of inflation stems from Milton Friedman’s monetarism:

According to Friedman, “inflation is always and everywhere a monetary phenomenon.” What he meant was that too much money is the culprit in any inflationary episode. If prices weren’t stable, it was because the central bank was trying to force the economy to create too many jobs by allowing the money supply to increase too rapidly.

The early neoliberal Friedman insisted that the Fed must never interfere with the workings of the market. Specifically, the Fed should not try to reduce unemployment below a certain level, which came to be called NAIRU, the non-accelerating inflationary rate of unemployment. Friedman thought there had to be some minimum level of unemployment in the economy. [1] The Fed bought into this view, as did politicians of all stripes. They all agreed that to keep prices stable, the US has to accept a certain level of unwanted unemployment. And to be on the safe side, maybe a bit higher level of unemployment. In practice, Congress dumped the problems of inflation and unemployment on the Fed.

But problems arose. The NAIRU isn’t visible or measurable. It can only be seen in retrospect. And now we are pretty sure there isn’t a clear relationship between inflation and unemployment, as the Fed assumed. [2] The Fed Chair, Jerome Powell, freely admitted to Rep. Alexandria Ocasio-Cortez that the Fed has been wrong about NAIRU, but defended its use on the grounds that “We need to have some sense of whether unemployment is high, low or just right.” P. 53.

2. The Problem of Unemployment

It turns out that the Fed used the purported correlation between inflation and unemployment as its primary tool for controlling inflation, ignoring all other causes of inflation. When the economy heated up and unemployment dropped, workers gained market power, and their share of national income increased. That led the Fed to raise interest rates leading to a tightening of the economy and usually a recession, as the following chart shows.

Gray bars indicate recessions.


Kelton calls this a “human sacrifice”, forcing some people out of the workforce when they want to work and can be productive. She thinks we are asking too much of the Fed. It can’t spend money into the system; only Congress can do that. All the Fed can do is change the cost of borrowing. If unemployment is too high, the Fed can make borrowing cheaper, but it can’t force anyone to borrow. Usually when unemployment is high, no one wants to borrow. I note that this was what happened after the Great Crash. The Fed cut interest rates to zero and lowered bank reserve requirements, hoping to increase money going into the economy. It didn’t work.

3. The Job Guarantee

Kelton argues that a better way to deal with unemployment is a job guarantee. Every person who wants to work should be able to get a decent job with decent pay and decent benefits. If the private sector won’t provide those jobs, the government should. [3] Kelton discusses this idea and its foundations.

It would probably be impossible for Congress to monitor the economy closely enough to manage full employment by tweaking taxes and spending. A job guarantee would act as a safety-valve and an automatic stabilizer for the economy and help solve this problem, leaving the Fed free to focus on inflation. If the private sector needs all the workers it can find them. If not, the government hires people to do jobs that need doing. There is plenty of work that needs doing, and, as Kelton pointed out elsewhere, we can always use more flowers in our parks and boulevards.

4. Preventing Inflation

So how should Congress budget knowing that the only effective constraint on spending is inflation? What would change? The way Congress currently works is that every bill that calls for expenditures gets a score from the Congressional Budget Office that assesses the impact of the expenditure on the deficit over a ten-year period. If inflation were the constraint, then the CBO would offer a score based on the probable impact of the expenditure on inflation. If the economy is, as now, operating well below its capacity for producing goods and services, the possibility of inflation would be low.

If the economy is close to capacity, either as a whole or in part related to the area of expenditures, then Congress has to make hard calls. How important is the expenditure? Can we create “fiscal space” for the expenditure with taxes? For example, in the case of the entire economy humming along, a general income tax hike would take money out of most people’s hands so they would not be buying as much, leaving room for the government to buy more. If there is a bottleneck, a more focused tax or some other step might be necessary.

Conclusion

MMT recognizes that inflation is a crucial problem. It shows how it arises and how we should protect ourselves from it.

=====
[Graphic via Grand Rapids Community Media Center under Creative Commons license-Attribution, No Derivatives]

[1] Marx said that the reserve army of labour is a necessary part of capitalism. Hmmm.

[2] This relationship is embodied in the Philips Curve. I discuss it here.

[3] Other economists favor a universal basic income. Both have the added benefit of freeing workers from abusive or irritating employers. Your family won’t starve if you walk out on a bad situation.

Deficit Hawks Screeching In The Background

The deficit harpies are warming up in the background. [1] Inflation is just around the corner, they shriek, by which they mean Democrats might take over government. There must be a handbook in which their arguments are laid out probably in red ink. They claim that whatever the Fed and the Treasury do to help anyone has to be paid for sooner rather than later by increasing taxes. Those taxes will fall heavily on the capitalists, which (or who) will destroy economic growth. They claim the government is sucking up all the investment capital, which chokes growth. They say the vast amount of debt will hurt the standing of the US in international finance. It’s predictable and this time it’s silly.

1. The numbers. Congress has authorized $2.2 trillion in spending to deal with the economic impact of the Covid-19 crisis. That’s on top of other spending in a budget originally proposing a deficit of $!.1 trillion. With other spending on Covid-19 issues and reduced tax revenue, the current estimate for fiscal 2020 is about $3.8 trillion. We can reasonably assume another $1 trillion will be needed for states and municipalities, treatments and vaccines, and support for hospitals.

2. Funding Covid-19 expenditures. The US deficit is funded by the sale of US Treasury obligations. Sales are handled by a group called Primary Dealers, who act as market makers in Treasury securities. [3] In the past most of the debt is has been purchased by financial institutions for their own accounts or for the accounts of investors, or by the central banks of other countries. In the current crisis, the Fed has promised to buy all the Treasury debt. Here’s a good explainer. [2]

To get a picture of the situation, in the two months ended 30 April 2020, the national debt held by the public increased by $1.645 trillion. In the comparable period the Fed’s holdings of Treasuries increased by $1.448 trillion. The projected deficit during that period was about $183 billion, so we should estimate the increase in the total debt includes that amount. If we deduct that, we get an estimate of the amount of debt issued on account of the Covid-19 crisis of $1.462 trillion, meaning that the Fed purchased substantially all of the Covid-19 debt.

3. So what? The fear-mongering is based on two speculations: that the federal debt will have to be paid, or that interest rates will somehow increase, and either will have to be paid out of current tax revenues. In either case, we will have to increase taxes. [5] Another theory is that the Fed will have to sell off the Treasuries it bought into the private markets which will be bad for some reason.

The good news is that the Fed can just return the Treasuries to the Treasury in the form of a dividend, or a remittance in Fed parlance, and the debt drops by a like amount. Or the Treasury could pay off the securities and the Fed could remit that payment to the Treasury. If the Fed wants to hold the securities to help it control interest rates or for other reasons, it can just remit the interest payments to the Treasury.

Why would anyone think otherwise? That is the power of neoliberal ideology, which has taken root in the minds of practically every media personality and Twitter economist. There was a moment after the Great Crash when similar questions were raised, but no one paid any attention to see what happened after that, which was a big fat nothing.

It’s possible that the Treasuries aren’t the problem, it’s all the trillions of new dollars flooding the world that will cause inflation. This might actually happen in different circumstances, so it requires a bit of explanation.

1. Demand has fallen dramatically as we cope with lockdown, and in turn, income to business and working people have collapsed. This new money is largely going to people and businesses who need it to replace part of the income they would usually derive from their normal business activities or from employment. It won’t create new demand as it might have six months ago. It just replaces lost income, enabling people and businesses to avoid bankruptcy. It’s true that there are inflationary pressures on certain things, such as medical supplies and equipment. That’s just normal capitalist price-gouging, and unlike similar cases, say, lumber after hurricanes, won’t be prosecuted.

2. Most US business sectors are oligopolies, meaning that three or four companies control 80% or more of revenues. This is certainly true in the medical sector, including the drug business. Thus, salvaged demand paid for by the new money will flow to capitalists. It may be that some will be needed to expand production in some areas and reduce production in others. The rest will go to capitalists, in the same way the Trump tax cuts did, in the form of dividends and stock buy-backs. It is highly unlikely to have a serious inflationary effect.

3. If, however, there were a problem, there is a solution. Congress can increase taxes. The good news is that it can do so in a way that won’t actually impact working people. Congress can hike taxes on the capitalists and on capital.

a. This makes sense in an oligopolistic economy, which is by definition not competitive. When capital flows into oligopolistic businesses, some of the money goes into some new productive use. The rest goes to capitalists. Taxing oligopolistic profits away means that there won’t be inflation in the things only capitalists buy, giant yachts, private jets, politicians, and political favors, for example. Taxing them is doing a service in tamping inflation that only affects them.

b. Republicans will choke on tax hikes. But if inflation driven by all the new money is a problem, it’s one they caused. They threw away any claim to their version of fiscal responsibility when they cut taxes on the rich in the middle of an expansion. If inflation arises, they can’t expect the Fed to fix it for them, because they wouldn’t be able to survive the depression that would cause, just as Carter couldn’t survive the Volcker recession.

c. If this sounds like a layman’s take on Modern Money Theory, well, it is. I hope I got it right.

Update: Shortly after I posted this I saw this headline in the Washington Post: Top White House advisers, unlike their boss, increasingly worry stimulus spending is costing too much.
======
[1] Here are some examples. This is a fairly restrained version. Here’s one from the Federalisr; I read it so you don’t have to, it’s ridiculously wrong on everything, including the conclusion:

In summary, the newly proposed bailout and stimulus packages smack of big government welfarism and crony capitalism. These are the sort of policies that will move the needle toward socialism, impoverishing us and stripping the productive engines of our economy.

I think the writer is worried about our precious national bodily fluids.

Here’s one from a columnist for the Arizona Republic, saying that this is bad, bad, even if the guy has been expecting disaster his entire career. It’s easy to see how this guy scared himself with numbers.

Here’s one explaining that the Fed buying municipal securities from towns and states shifts tax burdens to national taxpayers. That’s aimed specifically at my home state, Illinois, and I hope every shithead who makes this argument loses 75% of their deferred income. Here’s one from the occasionally sober SeekingAlpha.

One more from USA Today, complete with towering red bar graphs.

[2] After the Great Crash, the Fed made a similar promise. Buying and selling Treasuries is one way the Fed controls interest rates. And it’s worth noting that Treasuries are often used by financial institutions in various short-term transactions, such as repurchase agreements, and as collateral for short-term loans, rather than as investments or savings.

[3] Here’s the Wikipedia entry on Primary Dealers, which lists the current dealers.

[4] The Fed’s weekly balance sheets are here. Debt figures from the Treasury are here.

[5] This idea never surfaced from the Republican wing of deficit hawkers when the Republicans insisted on tax cuts in the middle of an economic expansion. And for Grover Norquist, I note that a government small enough to drown in a bathtub has proven to be a nightmare in responding to Covid-19. Norquist and his groupies drowned the federal government’s administrative ability to cope with the pandemic.

The Slow Death of Neoliberalism: Part 3 The Phillips Curve and Critical Theory

Part 1.
Part 2.

I described attacks on the Phillips Curve in Part 2. This part discusses the history of the Phillips Curve in detail, and concludes with a discussion of the problems revealed by the failure. The Observations are the fun part if this is too long.

History of the Phillips Curve

This section is based on parts 1-3 of The History of the Phillips Curve: Consensus and Bifurcation by Robert Gordon, an economist at Northwestern, published in the 2008 in the journal Economica at p. 10 et seq. (behind paywall, but available online through your local library). In 1958, William Phillips published a paper which as Gordon puts it,

… replaced discontinuous and qualitative descriptions by a quantitative hypothesis based on an unusually long history of evidence. Since 1861 there had been a regular negative relationship in Britain between the unemployment rate and the growth rate of the nominal wage rate. P. 12.

Phillips fitted a curve to data from the period 1861-1913, and plotted data for the remaining periods, through 1957 against that curve to find disagreements. Phillips found that his curve was close across the entire time except for a couple of years that he explains away. Here’s the curve Phillips fitted to his data:

1) wt = -.90 + 9.64U-1.39

Gordon says “… the inflation rate would be expected to equal the growth rate of wages minus the long-term growth rate of productivity.” P. 12.

1a) p = w – k

For some reason p is inflation and k is productivity. Upper case letters are levels and lower case letters are rates of change. So equation 1 can be written

2) p = -.90 + 9.64U-1.39 – k.

Paul Samuelson and Robert Solow discussed the Phillips results in the US context in a 1960 article. They found no similar data for the US, but they did some estimates and suggested that the PC doesn’t fit their data for several periods, and that it can shift up and down. Phillips estimated that an unemployment rate of about 2.5% was consistent with zero-inflation, while Samuelson and Solow think it might have been 3% pre-World War II and was about 5-6% in the early 60s.

With this seal of approval, the idea was incorporated into econometric models in two equations. In one, the PC was embodied and other variables were added, including demand, unemployment, the rate of change of unemployment, taxes, expected inflation and others in different combinations. This result was fed into an equation that calculates inflation based on wage levels, price levels and trend productivity. Gordon explains that

The reduced form of this approach implied that the inflation rate depended on the level and rate of change of unemployment, perhaps other measures of demand, and lagged inflation.

This is followed by a long discussion of the views of the Chicago School, which Gordon dismisses as utter failures. Moving along to 1975, Gordon turns to efforts to modify the Phillips Curve by adding supply and demand shocks. The price of oil shot up in 1973 because of OPEC. The demand for oil doesn’t decrease quickly in the short run, so people spend more on oil and less on other things. The Phillips Curve didn’t predict the results. Gordon says

The required condition for continued full employment is the opening of a gap between the growth rate of nominal GDP and the growth rate of the nominal wage to make room for the increased nominal spending on oil. P. 21, cite omitted.

That means wages must fall, Gordon says, or we have to add money to the economy, but the latter would lead to inflation. What we actually did, he says, was wage rigidity, increased unemployment, and some nominal (meaning not adjusted for inflation) GDP growth. Gordon then developed and published this version of the Phillips Curve:

3. pt = Ept + b(Ut – UtN) + zt + et

The second U term is the “natural” rate of unemployment, which I’m not going to take up. The z term represents cost-push pressure from unions and supply monopolies. The e term is apparently a constant but it seems odd that it might vary over time. Gordon explains that this version incorporates inertia, the idea that if there’s inflation in one period, there will be inflation in the next. It also reflects supply and demand issues, like wage and price rigidity.

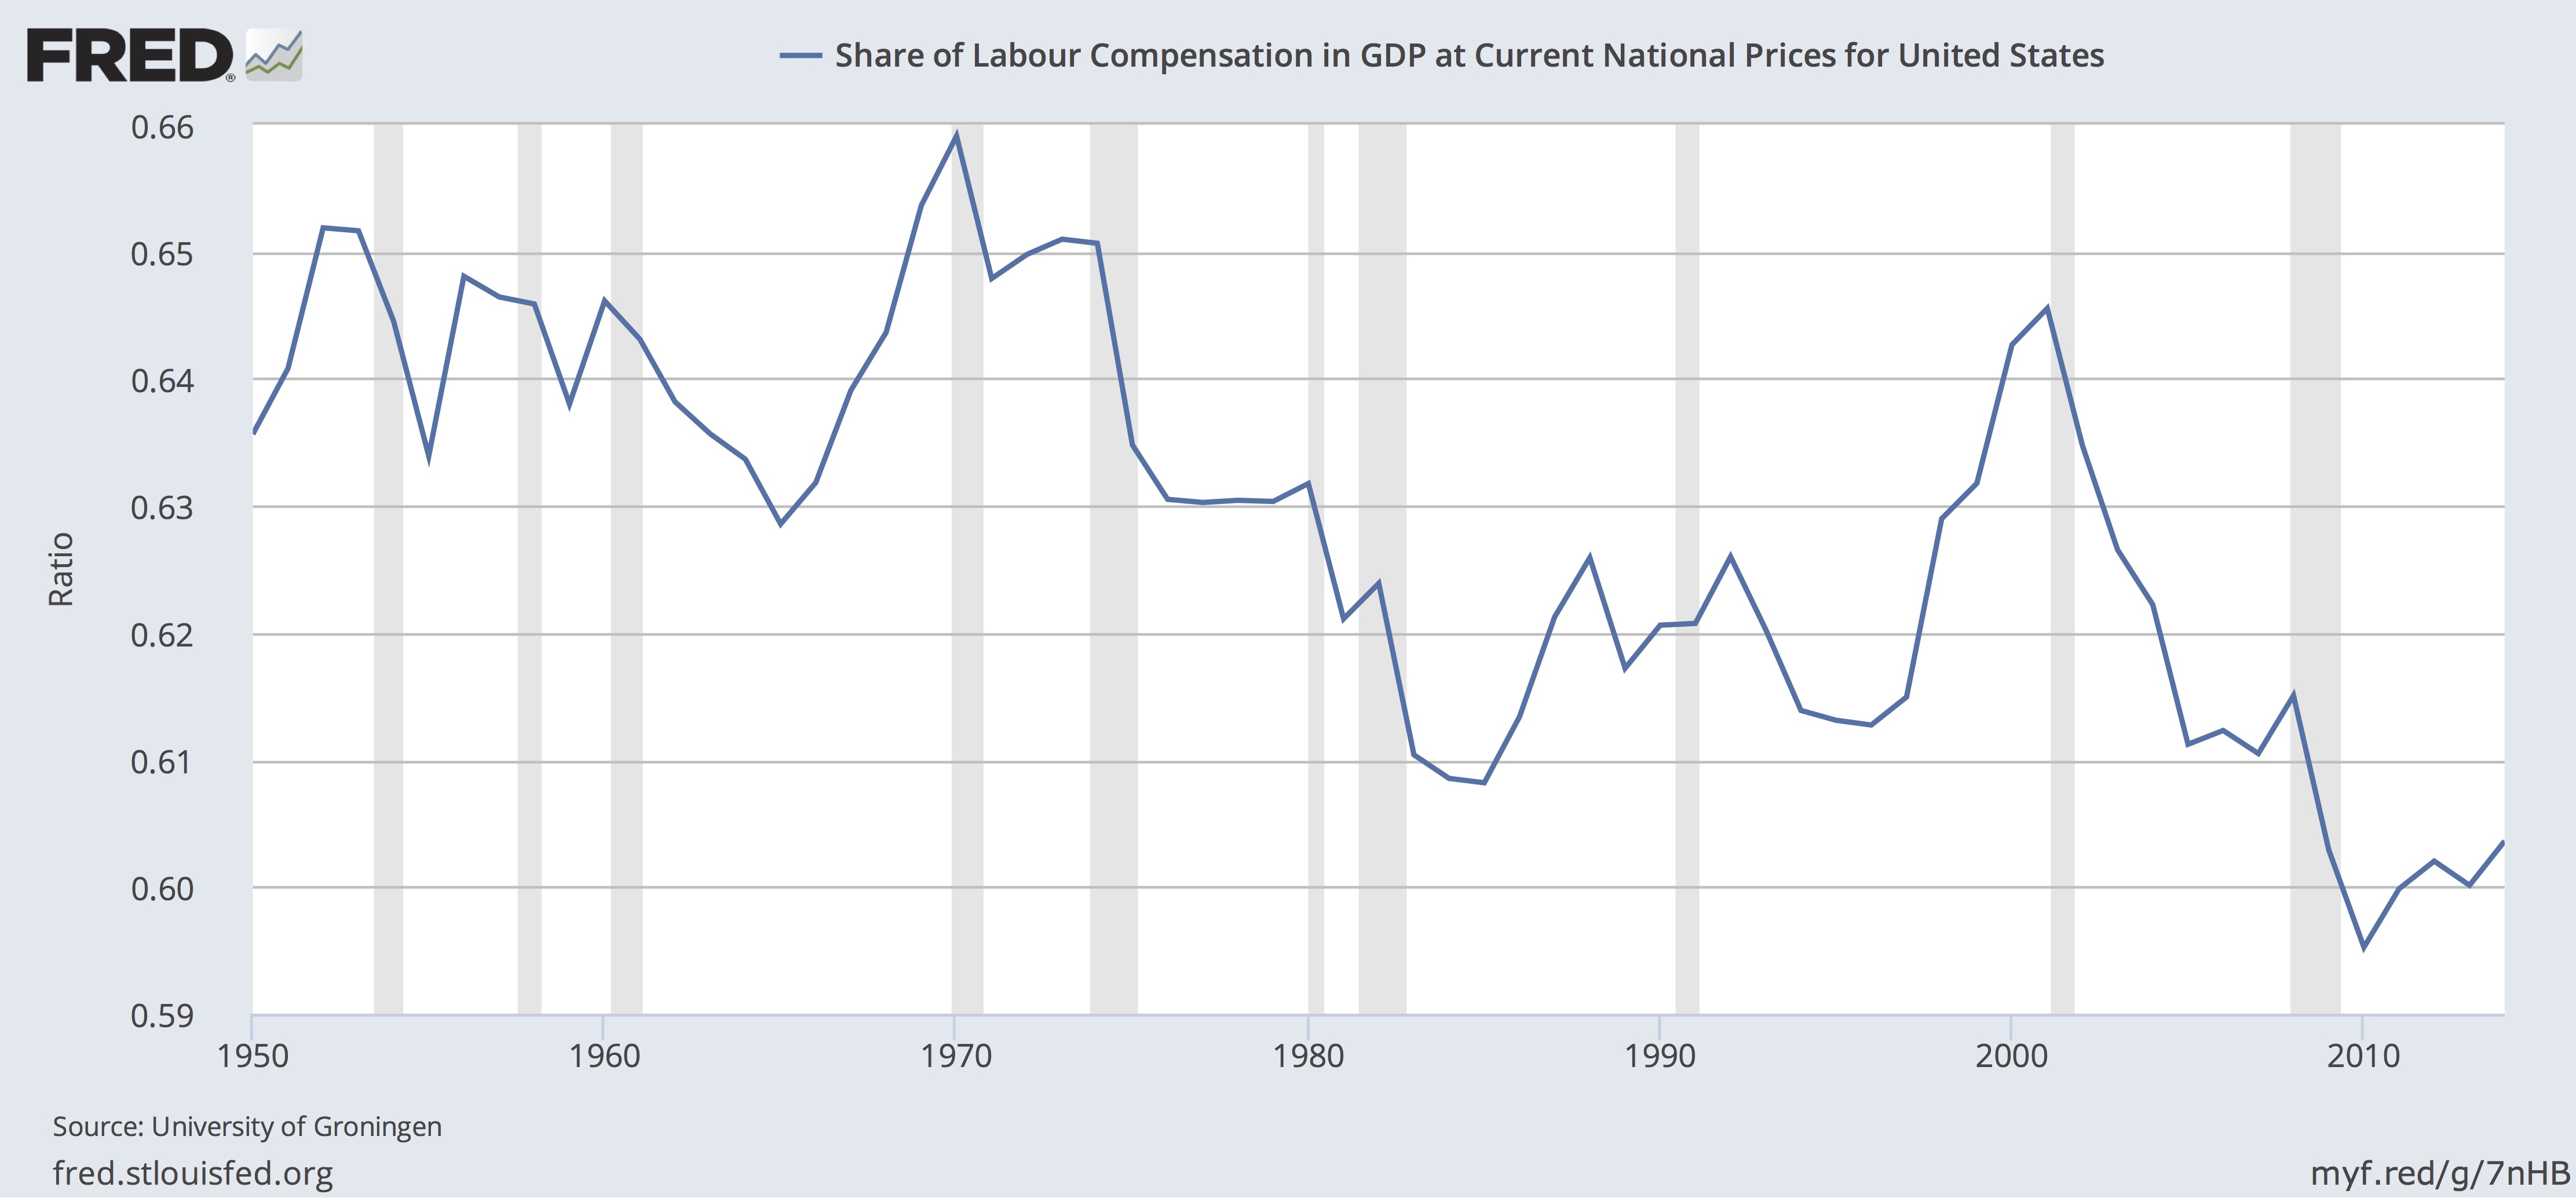
Gordon then mentions in passing that the wage equation (Equation 1a) is only valid if labor’s share of the GDP is fixed, but it isn’t. Here’s a chart from FRED

That problem, says Gordon, is “fruitfully ignored”. We don’t need to consider wages, we just look at prices. With these changes, we can understand the past by explaining away variations with negative or “beneficial supply shocks” and other variables. Gordon says that Equation 3 is foundation of the mainstream model. There is a related model, the New Keynesian Phillips Curve which is similar except that it incorporates future expectations of inflation, and makes no specific provision for supply and demand shocks. I assume these in some combination are the models used by the Fed, and heavily criticized as discussed in Part 2.

Observations

The concept is replaced by the formula, the cause by rules and
probability. Dialectic of Enlightenment, Horkheimer and Adorno,p. 3.

1. Phillips was working off empirical data when he fitted his curve, data about inflation and the rate of growth of wages. There are some theoretical issues in the preparation of that data. But the only abstract theory he adds to his data is Equation 1a, which Gordon says has a solid base in intuition. At the time he was writing, Phillips would only have seen data supporting that theory. We have new information:

As it happens, and perhaps not surprisingly, Phillips’ Equation 1 doesn’t work on US data. Gordon himself and others start adding things to make the Philips Curve work. They are convinced that there is a link between unemployment and inflation, and that they just need to add the relevant variables from their theoretical arsenal to get it to come out. Some focus on expectations, others on supply and demand shocks, and others add taxes or something else. Once they get those pesky variables set up, it’s just a matter of solving for constants. The point is to fit a curve to the actual data, not to use the actual data to see what’s happening. The concept connected to the real world is gone, replaced by the formula. The cause is replaced by the rules of economics.

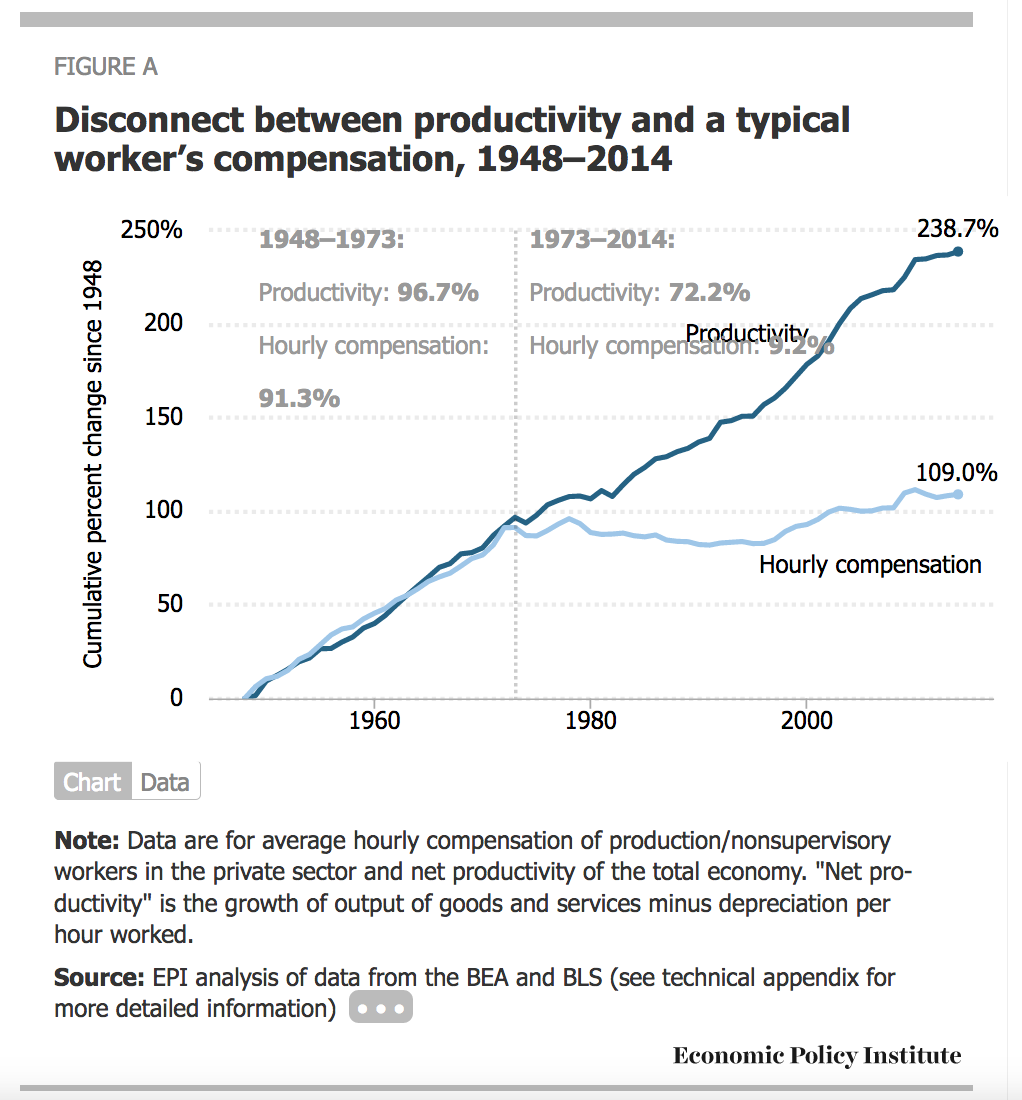
2. If we set inflation at 0 in Equation 1a, the rate of wage growth is equal to the rate of productivity growth. As the above chart shows, this relationship broke about 50 years ago. If all the gains from productivity are not going to labor, they are going to capital. Of course, capital takes several forms, for example, housing, agricultural land and other domestic capital. See, Piketty, Capital in the Twenty-First Century, Figure 4.6. When you think about it, it seems almost impossible that some of the gains from productivity weren’t going to capital all along. But in the current economy, it’s obvious that companies like Facebook can provide vastly more services with disproportionally fewer additional employees, few of whom are well paid, so that most of the gains from increased sales go to capital. Or, suppose that manufacturing is outsourced, reducing labor costs. Some of the gains might go to cutting prices but surely some go to capital. Let’s rewrite Equation 1a to reflect this, using γ for the growth rate capital.

1b) p = w + γ – k.

Using Equation 1b instead of 1a, we would have this instead of Equation 2:

4) p = -.90 + 9.64U-1.39 + γ – k.

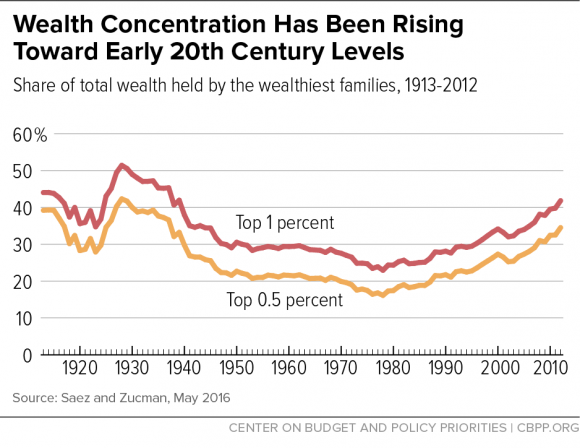
This equation focuses attention on the changes in the return to capital. That issue never seems to trouble most economists, but the rate of return to capital is the central focus of Piketty’s Capital In The Twenty-First Century. This chart from the Center on Budget and Political Priorities shows that top wealth started on its climb at the same time wages diverged from productivity, which supports the idea that gains from productivity are going to capital:

It also calls attention to the fact that nowhere in Gordon’s paper is there a mention of power, market power, political power, or social power, all of which Piketty talks about. Actually, hidden away in Gordon’s article is a backhanded reference to power. Equation 3 (Equation 7 in Gordon’s paper) includes a term “…zt to represent ‘cost-push pressure by unions, oil sheiks, or bauxite barons’”. P. 22. Obviously Gordon understands that the power to control the price of goods and services could create a negative supply shock, and the loss of control could produce a beneficial supply shock. P. 25. However, this is not explicit, and it certainly doesn’t deal with our current economy, in which almost all goods and services are dominated by a small number of gigantic companies exercising a significant degree of price control.

The tweaking Gordon describes might work for a while, but as the degree of price control through monopoly and oligopoly power increases, and γ becomes a bigger factor, the tweaks quit working.

3. Let’s put this in a larger context. For many economists, the Phillips Curve is structural. But why would you think so? It seems more likely that the relationship holds in a certain set of social conditions, including legislation and regulation, power conditions, and people’s attitudes. A logical use of the data is to work out the conditions that must exist to make it so. That’s how Piketty approaches his inequality data.

It’s a mistake to use a coincidence to predict the future. It seems to be a particular problem in economics. Even people who seem to know better continue to believe in the Phillips Curve. Here’s the President of the Boston Fed, Eric Rosengren:

A number of papers at the conference highlighted that some of the economic relationships that are frequently assumed to be stable over time have proven to be not so stable as we have come out of the financial crisis. These structural changes mean that if you tried to have a model that was fairly invariant to these changes, or a process that was invariant to these changes, there would start being big misses in monetary policy.

He goes on to explain that we have to raise interest rates because maybe not the Phillips Curve, but when employment goes up, inflation goes up. Rosengren knows there’s a problem, but he doesn’t have any idea of how to cope, so he keeps doing what he thinks he knows is right. It’s another example of Horkheimer and Adorno’s statement in action.

Updated to define γ more exactly.

Mankiw’s Tenth Principle: Society Faces A Short-Run Trade-off Between Inflation and Unemployment

The introduction to this series is here.
Part 1 is here.
Part 2 is here.
Part 3 is here.
Part 4 is here.
Part 5 is here.
Part 6 is here.
Part 7 is here.
Part 8 is here.
Part 9 is here.

Mankiw’s tenth principle of economics is: Society faces a short-run trade-off between inflation and unemployment. He admits that this is more controversial among economists than his other principles. He says that most believe this explanation:

  • Increasing the amount of money in the economy stimulates the overall level of spending and thus the demand for goods and services.
  • Higher demand may over time cause firms to raise their prices, but in the meantime, it also encourages them to hire more workers and produce a larger quantity of goods and services.
  • More hiring means lower unemployment.

This line of reasoning leads to one final economy-wide trade-off: a short-run trade-off between inflation and unemployment.

This gives economic policy-makers a tool for influencing economic trends. “By changing the amount of money it prints”, says Mankiw, government can put more or less money into the economy, and thus influence unemployment, at least in the short run. The Great Crash of 2008 is an example. Mankiw explains that it was caused by “bad bets on the housing market”, and led to high unemployment and lower incomes. The Obama administration responded with a stimulus package of spending and tax cuts, and the Fed increased the amount of money in the economy, in an effort to reduce unemployment. He adds: “Some feared, however, that these policies might over time lead to an excessive level of inflation.”

The frightened people were, of course, proven absolutely wrong, though they won the policy argument with the imposition of the Sequester. The stimulus package was too small, though at least it more or less happened, and of course spending on the military increased, which helped, though it would have been nice to have something for the money besides the worthless F-35. This discussion is fleshed out beginning at about page 490 (in the 6th Ed.) with a long discussion of the Phillips Curve. This Wikipedia entry is at least cheaper than buying Mankiw’s book. for those not familiar with the subject.

This isn’t so much a principle in the sense of an axiom as it is a theorem, worked up from axioms. The source of the idea is a 1958 paper by William Phillips, showing an historical correlation between inflation and unemployment in the UK, and extended to US data by Paul Samuelson and Robert Solow. The correlation and the explanation worked together to persuade people that both the grounds of explanation and the relationship were more or less permanent features of the economy. The ideas behind the explanation are neoclassical, so the correlation served to validate those neoclassical ideas.

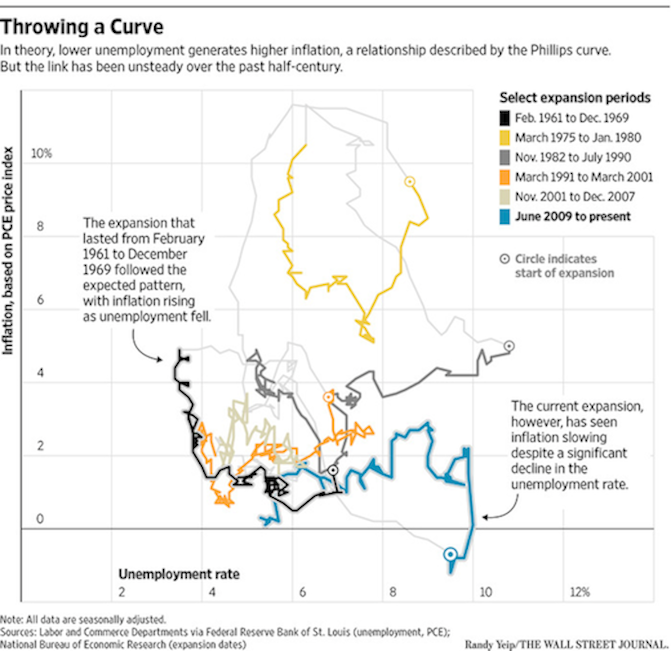
Recently the Wall Street Journal published an essay by Ben Leubsdorf discussing the current understanding of the Phillips Curve debate: The Fed Has a Theory. Trouble Is, the Proof Is Patchy. [Paywall]. Jared Bernstein discusses it in this post and links to this New York Times post; both are worth reading to see just how unhinged we are from the simple explanation offered by Mankiw. This chart is from the WSJ article.

Phillips Curve Chart 3

To read the chart, select an expansion, find the line in that color, and look for the circle, which is the beginning of the period. Then follow the line as it moves showing the changes in inflation (y-axis) and unemployment (x-axis). Here’s Leubsdorf’s explanation:

But the simple link between U.S. unemployment and inflation described by the Phillips curve appeared to break down after the 1960s. High inflation coexisted with high unemployment in the 1970s. In the 1990s, the jobless rate fell as price pressures weakened. Over the past three years, inflation has declined despite a falling jobless rate.

Mankiw says there is dispute among economists about this, and Leubsdorf confirms that. He says that a recent WSJ survey found that 2/3 of economists “believed that the link exists.” Here’s a quote from a believer, Atlanta Fed President Dennis Lockhart.

“In the absence of direct evidence that inflation is in fact converging to the target and in the absence of compelling or convincing direct evidence, I think a policy maker has to act on the view that the basic relationship in the Phillips curve between inflation and employment will assert itself in a reasonable period of time as the economy tightens up ….

Economists are fully aware of the problems with the Phillips Curve, and there are plenty of attempts to make it better. This is from the conclusion of an April 2015 Working Paper by Laurence Ball and Sandeep Mazumder of the International Fund:

One of Mankiw’s (2014) ten principles of economics is, “Society faces a short-run tradeoff between inflation and unemployment.” This tradeoff, the Phillips curve, is critically important for monetary policy and for forecasting inflation. It would be extraordinarily useful to discover a specification of the Phillips curve that fits the data reliably. Unfortunately, researchers have repeatedly needed to modify the Phillips curve to fit new data. Friedman added expected inflation to the Samuelson-Solow specification.

Subsequent authors have added supply shocks (Gordon, 1982), time-variation in the Phillips-curve slope(Ball et al., 1988), and time-variation in the natural rate of unemployment (Staiger et al.,1997). Each modification helped explain past data, but, as Stock and Watson (2010) observe, the history of the Phillips curve “is one of apparently stable relationships falling apart upon publication.” Ball and Mazumder (2011) is a poignant example.

Even today people are looking for a way to find something useful in past data to predict future outcomes. As Leubsdorf noted, the Fed is using some version of this curve in deciding when to raise interest rates.

So, how does this fit with neoliberalism? One of the goals of neoliberal economics is the protection of established wealth. Inflation erodes wealth. Returns to capital may or may not keep up with inflation, depending on the strength of labor and other factors of production. Debtors are able to repay their debt in less valuable dollars, which erodes the assets of creditors. If the increased returns are less than the erosion, wealth suffers. As we have seen in the wake of the Great Crash, the governing power structure of neoliberalism demands that capital be protected whether in the form of equity or debt. This principle tells policy makers to put people out of work rather than suffer inflation.

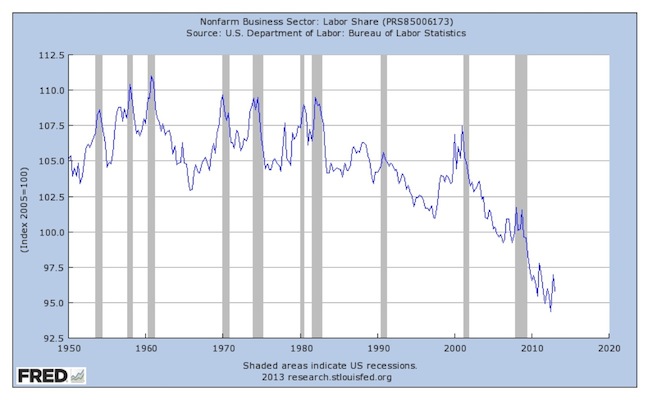
The Fed follows this principle. This is a chart of the labor share of income.
labor share 1
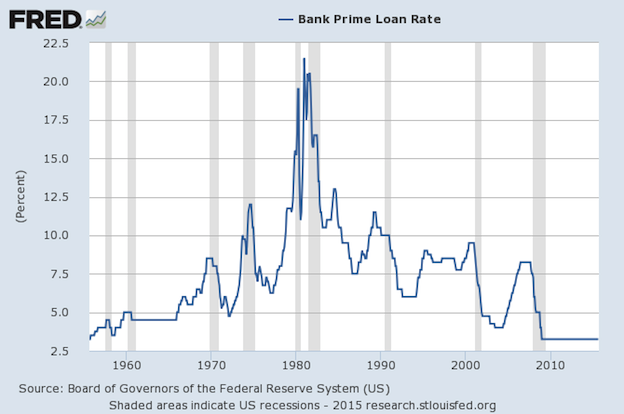
The gray vertical bars are recessions. The chart shows that as the labor share rises, we get a recession. The following chart shows bank prime rates.
Bank Prime Rate
As interest rates rise, we get recessions. With the exception of the recession that followed the Great Crash, it’s fair to say that all of these recessions were engineered by the Fed because of inflation or fear of inflation.

The implications are fascinating. Before the Great Crash, almost all US money was created by bank lending and credit expansion. Mankiw’s Principle No. 9 tells us that when too much money is created, we get inflation. The Phillips Curve tells the Fed it has to raise interest rates to stem inflation, and that it does so at the cost of putting people out of jobs. So, businesses lend and borrow too much, creating inflation or fear of inflation, and to solve the problem created by the failure of capitalists, the Fed makes sure only the working people pay the price, by losing their livelihoods, and lately, by watching their incomes stagnate or drop. And that is the outcome of applying Mankiw’s Principles of Economics: damaging workers to protect the rich.

Mankiw’s Principles of Economics Part 9: Prices Rise When the Government Prints Too Much Money

The introduction to this series is here.
Part 1 is here.
Part 2 is here.
Part 3 is here.
Part 4 is here.
Part 5 is here.
Part 6 is here.
Part 7 is here.
Part 8 is here.

Mankiw’s ninth principle of economics is: Prices Rise When the Government Prints Too Much Money. He describes hyperinflation in the Weimar Republic in Germany in the early 1920s. The US hasn’t experienced hyperinflation, but it has had problems with inflation, as in the 1970s. He says that inflation imposes costs on societies, so a goal of policymakers is to keep it under control. He tells us the cause of inflation:

In almost all cases of large or persistent inflation, the culprit is growth in the quantity of money. When a government creates large quantities of the nation’s money, the value of the money falls. … The high inflation of the 1970s was associated with rapid growth in the quantity of money, and the low inflation of more recent experience was associated with slow growth in the quantity of money.

As stated, this principle doesn’t sound quite right. In the US, at least, the government doesn’t print money, as we found out in the uproar over the Trillion Dollar Coin. That idea brought out the flying monkeys, shrieking that it would be wildly illegal for the Treasury to mint money other than small coins. According to Mankiw, in the US substantially all money is created by banks, as he explains in Chapters 16 and 17. He gives the standard description of fractional reserve banking. He explains that the Federal Reserve Board can add to bank reserves, thus creating the possibility of new loans that will create new money, or reduce reserves, reducing the ability of banks to create new money. These tools enable the Fed to control the money supply. He acknowledges that there are serious difficulties facing the Fed in exercising that control, but he claims it can be done as long as the Fed is “vigilant”. Chapter 16, page 339. With this explanation, it is not clear why Mankiw claims that government is responsible for inflation by printing too much money.

One of the difficulties Mankiw describes is the problem of measuring the money supply. In the US, there are two broad measures of the money supply, M1 and M2. The Fed quit publishing a third figure, M3, in 2006, but it is estimated by the OECD. Here’s a handy chart from Wikipedia showing the various measurements of money supply. For those interested, here’s an Austrian definition of money supply. And here’s an argument for including repurchase agreements in the calculation of the money supply. I’m not quite sure how Mankiw would measure the money supply for his principle, especially because other economists don’t agree.

I’m also not sure what to make of Mankiw’s claim that the inflation of the 1970s was associated with a “rapid increase in the quantity of money.” Here’s a chart showing the growth of M2 for the period 1965 through 1985. It looks like it is rising, a bit faster after each recession (grey bars). It looks to me like the next chart, gross domestic product over the same period seasonally adjusted. Perhaps there is some other factor, or maybe I’m just reading this wrong.

M2 65-85

GDP 65-85
Here’s a chart of M2 from 2000 to the present. There is a noticeable increase in the rate of growth of the money supply in the immediate wake of the Great Crash, leveling off in March 2009. Starting about August 2010, the increase is again greater than in the pre-Crash years. These rapid increases in the money supply match up with the Fed’s Quantitative Easing programs. It has not, as many economists (not Mankiw) predicted, led to rapid inflation.

M2 2000-2015
That points us to the central question raised by the principle: how much money is too much? If Principle 9 were a scientific principle, we could use it to work out an equation for the correct amount of money, either empirically or theoretically. Mankiw doesn’t offer either. Instead, he has a section explaining the debate between those who think the Fed should have discretion and those who think the Fed should follow a strict rule, like increasing the money supply by 3% per annum. P. 520. It isn’t much of a principle if it doesn’t lead anywhere, and doesn’t predict anything.

Mankiw’s phrasing, blaming the government for inflation because of its intervention with the operation of markets, fits nicely with Mirowski’s 10th Commandment: Thou Shalt Not Blame Corporations and Monopolies. It supports Mirowski’s Third Commandment, calling for full reliance on the marvelous market and making sure governments don’t interfere. We get a good look at this in a recent paper by Thomas Palley who has been writing about neoliberalism for some time, titled The US Economy: Explaining Stagnation and Why It Will Persist. Palley says that there are three explanations for the Great Crash.

1. The hardcore neoliberal explanation: it was all the fault of the government. Interest rates were forced too low for too long in the wake of the 2000 recession, interfering with the market for money. For purely political reasons, the government intervened in the housing market to encourage increased homeownership, leading to misallocation of scarce financial and other resources. This is the position of Peter Wallison of the AEI, whose dissent from the Final Report of the Financial Crisis Inquiry Commission explains this view. It is not recommended reading.

2. The softcore neoliberal explanation: it was the fault of government regulators. The regulators allowed excessive risk-taking by lenders, and perverse incentive pay structures in the financial sector. They allowed deregulation to proceed too far. That enabled bad allocation of the flood of foreign savings into an overblown housing sector. When it popped, the resulting financial disorder deepened a structural business cycle recession into a near depression.

3. The Keynesian explanation: neoliberalism did us in. The explanation is that neoliberal policies destroyed the institutions and rules that kept corporate greed in check and made sure that the benefits of a growing economy were shared between capital and labor. In the end, consumer demand was crushed by inadequate wages. It slowed to the point that it could not drive economic growth as it had during the period 1950-75. As incomes dropped, debt rose, so that when the Great Recession hit, there was no demand left to drive a recovery. The cycle of jobless recoveries has come to the point that stagnation is the plausible future for the US economy.

Mankiw argues for neoliberal explanations and solutions and certainly not the Keynesian explanation or its solutions. For example, in October 2008, he wrote that the Great Depression was largely cured by monetary policy, and pointed to studies saying that New Deal legislation like the expansion of labor rights was counter-productive because it allowed labor power to interfere with market forces.

I don’t doubt that the quantity of money might have something to do with inflation in some cases. I’m not convinced that it explains either the inflation of the 1970s, the lack of inflation in recent times, or the current inflation in Russia.